

Suppose a retailer rolls out a new inventory management system across 200 stores. Six months later, stockouts are down 15%. The VP of operations is thrilled. But should she be?
Maybe those stores were already trending downward in stockouts. Maybe the economy shifted. Maybe a competitor exited the market, changing demand patterns entirely. The 15% figure is real, but what it means is not at all obvious. To say the new system caused the improvement, you need something more than a before-and-after comparison. You need causal thinking.
The causal question is one of the basic questions we often consider in life before making any decision. However, based on the importance of the outcome, we rely on a spectrum of tools at our disposal, ranging from guessing to rigorous evaluation of causal mechanisms.
Correlation and Causation
In regression analysis, we model the relationship between the independent variables and the outcome variable and examine how changes in the independent variables affect the outcome. Similarly, in machine learning, we use a training dataset to train our model and a test dataset to evaluate it. We then use this model for prediction. However, prediction and causation are different.
Last semester, while taking the class on Causal Inference, I came across Brady Neal’s website on causal inference. He outlined the concept of causality in his course very clearly, using the example of shoe sleepers. The fallacy that correlation implies causation is a cognitive bias. An example of spurious correlation is the correlation between the number of films in Sylvester Stallone’s filmography and the number of milwrights in North Dakota (https://www.tylervigen.com/spurious-correlations).
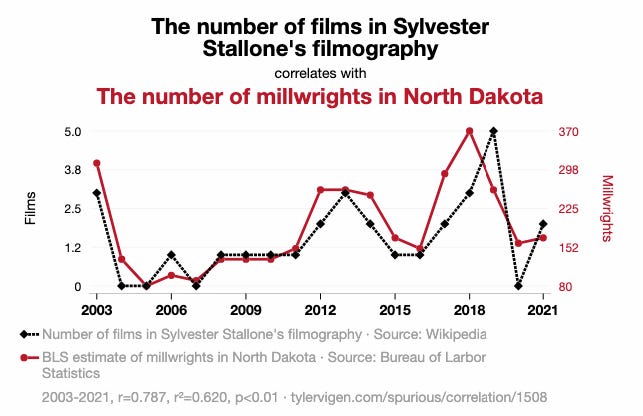
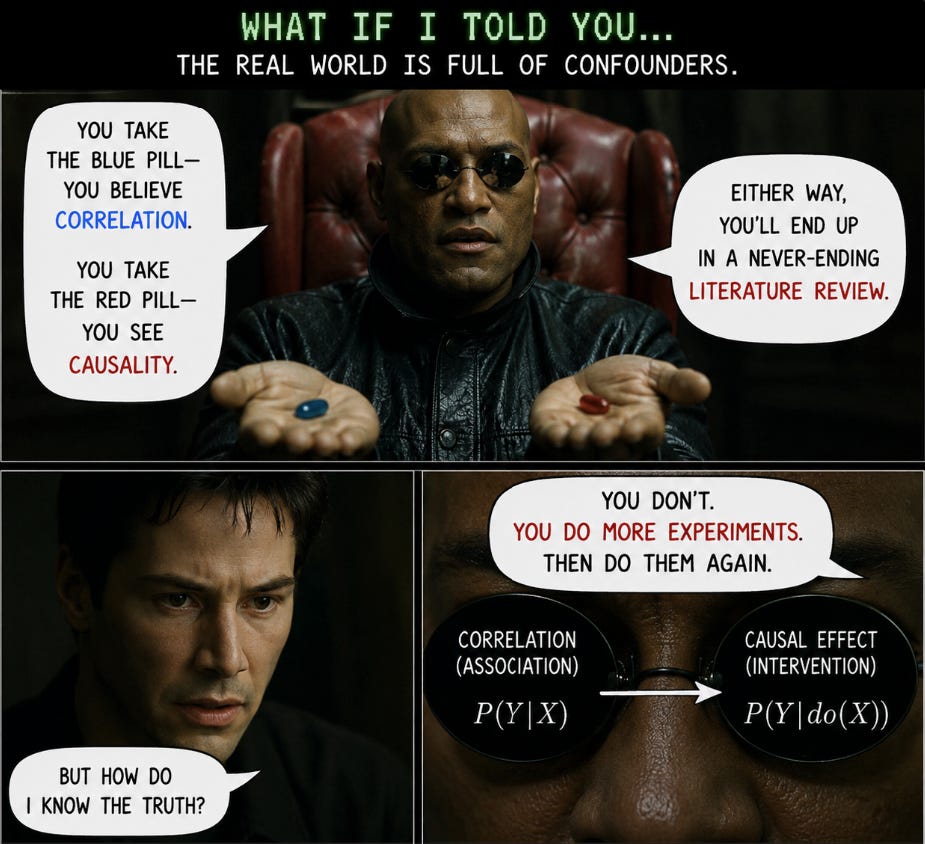
Understanding the difference between correlation and causation can really help clarify things. Correlation simply shows that when one variable changes, the other tends to change as well, like a pattern. On the other hand, causation is about a direct cause-and-effect relationship, meaning one change actually causes the other. It's important to remember that correlation doesn't always mean causation. For instance, if a company starts using RFID tracking and notices better fill rates, it might simply be that more efficiently run companies are the ones adopting RFID initially. The actual impact of RFID on fill rates could be quite small, nonexistent, or even negative once you consider the costs of implementation and potential disruptions. Therefore, establishing causation is difficult.
The Fundamental Problem
For any individual unit, you can observe the outcome under control or outcome under treatment, but never both together. For example, a specific supplier has to decide whether to invest in an automation. If they invest, you observe the outcome under treatment. The outcome they would have experienced without investing is the counterfactual, and it is missing. So, we miss half the data for each unit. This is not a sample problem but a real world problem. To derive credible evidence for causality, we try to fill those counterfactual with credible data. Randomized experiments do it by making treatment assignment independent of potential outcomes, so the control group provides a valid counterfactual on average. For example, we can say that if the seed receives fertilizer, it will grow to a certain height. If it doesn’t get the fertilizer, it may grow to a different height. These heights are the potential outcome for the unit seed and treatment is the fertilizer. The fertilizer assignment is can be randomized (random assignment) without knowing which seed would grow well under either condition (fertilizer or no fertilizer). Therefore, the present assignment is unrelated to the unit’s pre-existing hypothetical responses under each possible assignment. Observational methods do it by making assumptions about the data generating process and leveraging design features of the data. Mathematically, we write as
Where T is treatment and Y(1) and Y(0) are potential outcomes.
Pearl’s ladder of causation
At the starting of my PhD journey, I had read an interesting book on causality named as “The Book of Why” by Judea Pearl. It organizes causal reasoning into three levels.
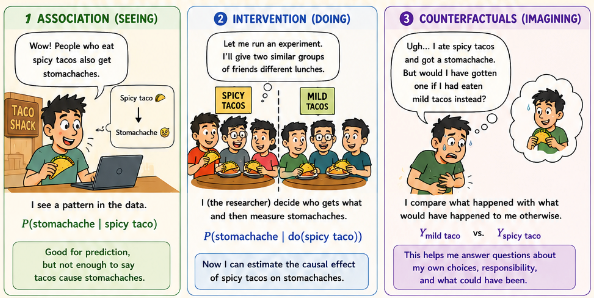
Lowest Rung - Association (Seeing): This is simply, you observe the data, find the patterns. For example, the customer who buys X also tend to buy Y (association rule) OR Supplier with higher lead time variability tend to have lower fill rates. These associations are used to make predictions using data science predictive analytics methods.
Second Rung - Intervention (Doing): This is causal rung. Here, we ask that what will happen to Y if we set a value of X? Pearl formalizes this with do-operator. The key insight is that doing is not the same as seeing. For example, if we see that hospitals with more doctors have higher mortality rate does not mean that adding doctors causes deaths. It may be the case that the hospitals with higher number of doctors are the larger hospitals and those patients who are very sick tend to go to those hospitals.
\(P(Y \mid do(X))\)Third Rung - Counterfactuals (imagining): Here we ask: Given what has actually happened, what would have happened under a different scenario? For example, would this supplier have met the delivery deadline if they had used air route instead of ocean?
\(Y_x\)So, altogether we have
\( \underbrace{P(Y \mid X)}_{\substack{X=\text{observed factor}\\Y=\text{observed outcome}}} \qquad \underbrace{P(Y \mid do(X))}_{\substack{X=\text{intervention}\\Y=\text{resulting outcome}}} \qquad \underbrace{Y_x}_{\substack{x=\text{hypothetical value of }X\\Y_x=\text{outcome under }X=x}} \)Spicy Tacos:
The Identification Problem
The credibility of causal claim doesn’t come from the estimation method we usually employ but it comes from the design itself. A well defined difference-in-difference with simple OLS regression can give a much solid causal claim than a poorly justified Instrumental Variable where the problems can be of weak instruments or some other design flaw. Athey and Imbens (2017) “The state of Applied Econometrics: Causality and Policy Evaluation” Journal of Economic Perspectives is an interesting read if anyone wants to go deeper into the area. In operations management domain, Ho et. al, (2017) talks about two major empirical challenges - Endogeneity and Selection Bias. The paper talks about different methods/tools to mitigate these challenges such as Instrumental Variable approach, Difference-in-Difference design, Regression Discontinuity Designs and others. Each of these tools have different assumptions and for an empirical researcher it is important to understand where these assumptions are plausible and can make sense (not all assumptions satisfy each settings) and where they breakdown. Based on this, the methods are chosen to answer a particular research question. For anyone looking for tools to tackle the empirical challenges, this paper is an essential read.
Thank you.
References:
Athey, S., & Imbens, G. W. (2017). The state of applied econometrics: Causality and policy evaluation. Journal of Economic Perspectives, 31(2), 3-32.
Ho, T. H., Lim, N., Reza, S., & Xia, X. (2017). Causal inference models in operations management. Manufacturing & Service Operations Management, 19(4), 509-525.
Pearl, J., & Mackenzie, D. (2019). The book of why. Penguin Books.
Neal, B. (2020). Introduction to Causal Inference. Course lecture notes, bradyneal.com